TSMI:Time-Series Mixing Image Dataset
– Overview
This database was created for the purpose of monitoring the state of ingredients during the cooking process and consists of a time-series collection of food images. By using this database, it is possible to evaluate monitoring performance in situations where ingredients are mixed during cooking.
The basic usage is to use the data in the train folder as training or validation data, and the data in the test folder as test data.
When you use this dataset in publications such as conference papers or journal articles, please cite the following URL or reference.
URL:http://isl.sist.chukyo-u.ac.jp/archives/tsmi
<Reference>
Yuma Hara, Rina Tagami, Hiroki Kobayashi, Shuichi Akizuki, Manabu Hashimoto, Study on the Effectiveness of Texture Features for Recognizing Mixed Ingredients in Cooking Processes, 31st Symposium on Image Sensing (SSII2025), IS1-24, pp.297-301, Koto-ku, Tokyo, 2025/5/28.
– How to collect data
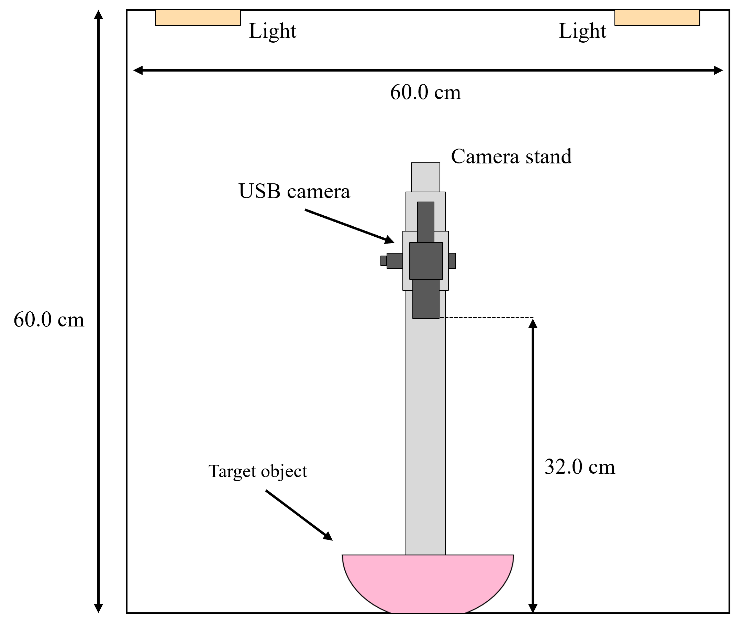
This dataset was constructed using a specialized imaging device.
An overview of the recording environment is shown in the figure below.
– Released Data
This database was created by cropping images (width 1920, height 1080, number of channels 3) taken using the above method at the upper left coordinate (570,120) and lower right coordinate (1370,920) before publishing them. All images are saved as PNG images. When photographing the data, I removed my hands and dishes from the camera’s field of view each time I mixed the ingredients to avoid occlusion of the ingredients.
Download: Overhead Cooking Task Monitoring dataset (1.57GB)[1] [2]
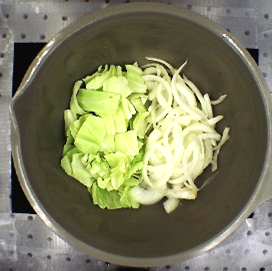
■cabbage&onion
 ■Train data(8 set, total 320 image, 340.2MB)
■Test data(2 set, total 80 image, 85.1MB)
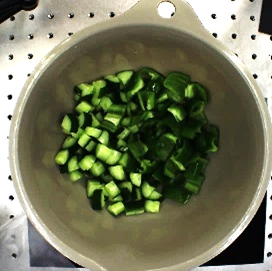
■cucumber&greenpepper
 ■Train data(1 set, total 40 image, 40.9MB)
■Test data(1 set, total 40 image, 41.1MB)
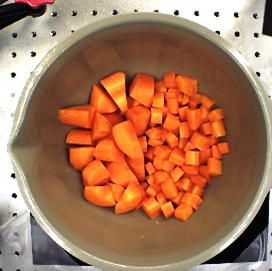
■large_carrot&small_carrot
 ■Train data(1 set, total 40 image, 42.4MB)
■Test data(1 set, total 40 image, 42.5MB)
■cabbage&chives
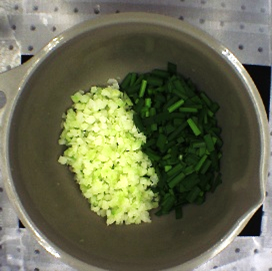 ■Train data(1 set, total 40 image, 38.3MB)
■Test data(1 set, total 40 image, 39.1MB)
■cucumber&radish&carrot
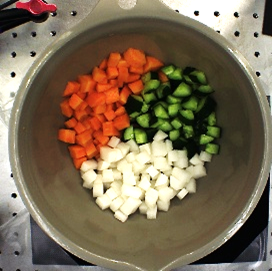 ■Train data(1 set, total 40 image, 42.2MB)
■Test data(1 set, total 40 image, 42.3MB)
■potato&carrot
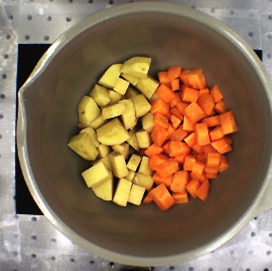 ■Train data(8 set, total 320 image, 321.3MB)
■Test data(2 set, total 80 image, 80.4MB)
■fried_tempura_bits&cabbage
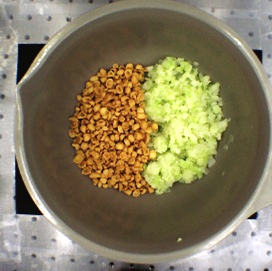 ■Train data(8 set, total 320 image, 334.2MB)
■Test data(2 set, total 80 image, 84.9MB)
– How to unzip file
Please replace
1. Combine the tar.gz parts
cat <dataset>_part_*.tar.gz > <dataset>.tar.gz
2. Extract the tar.gz file
tar -xvzf <dataset>.tar.gz
– Directory Structure
dataset
|--cabbage&onion
|  |--train
|  |  |--1
|  |    |--001.png
|  |    |--002.png
|  |  |--2
|  |
|  |--test
|
|-- cucumber&greenpepper
|-- large_carrot&small_carrot
|-- cabbage&chives
|-- cucumber&radish&carrot
|-- potato&carrot
|-- fried_tempura_bits&cabbage
This dataset contains seven categories: cabbage&onion, cucumber&greenpepper, large_carrot&small_carrot, cabbage&chives, cucumber&radish&carrot, potato&carrot, and fried_tempura_bits&cabbage. Each category contains training data (train) and test data (test).